Analysis
There are two classes for analysis: Alternative which provides methods for a Cost Benefit Analysis and Decision which provides methods for a Multiple Criteria Analysis. The Timeline class generates a Gantt Chart.
Alternative
[1]:
from datetime import datetime, timedelta
from dpd.analysis import Activity, Alternative, Currency

USD = Currency("USD", 2020, 0.07).discount()

a1 = Alternative(name="Alternative One")
planning = Activity(
    "Planning", datetime(2005, 1, 1), datetime(2009, 12, 31), 100 * USD, 0 * USD
)
construction = Activity(
    "Construction", datetime(2010, 1, 1), datetime(2014, 12, 31), 100 * USD, 0 * USD
)
operations = Activity(
    "Operations",
    construction.End,
    construction.End + timedelta(days=365 * 20 + 4),
    0 * USD,
    400 * USD,
)

for activity in [planning, construction, operations]:
    a1.add_activity(activity)

a1
[1]:
| Start | End | Cost | Benefit | |
|---|---|---|---|---|
| Planning | 2005-01-01 00:00:00 | 2009-12-31 00:00:00 | 100.0 USD (2020) | 0.0 USD (2020) |
| Construction | 2010-01-01 00:00:00 | 2014-12-31 00:00:00 | 100.0 USD (2020) | 0.0 USD (2020) |
| Operations | 2014-12-31 00:00:00 | 2034-12-30 00:00:00 | 0.0 USD (2020) | 400.0 USD (2020) |
[2]:
a1.benefit_cost_ratio
[2]:
$2 \; \mathrm{}$
[3]:
a1.period_range_pivot().head()
[3]:
| Cost | Benefit | |||||
|---|---|---|---|---|---|---|
| Planning | Construction | Operations | Planning | Construction | Operations | |
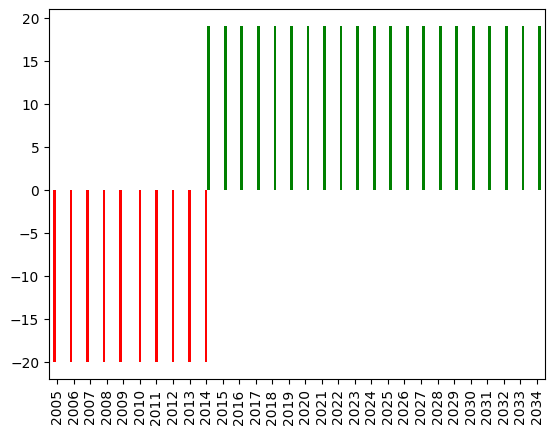
| 2005 | 20.0 USD (2020) | NaN | NaN | 0.0 USD (2020) | NaN | NaN |
| 2006 | 20.0 USD (2020) | NaN | NaN | 0.0 USD (2020) | NaN | NaN |
| 2007 | 20.0 USD (2020) | NaN | NaN | 0.0 USD (2020) | NaN | NaN |
| 2008 | 20.0 USD (2020) | NaN | NaN | 0.0 USD (2020) | NaN | NaN |
| 2009 | 20.0 USD (2020) | NaN | NaN | 0.0 USD (2020) | NaN | NaN |
[4]:
from matplotlib import pyplot as plt

fig, ax = plt.subplots()

a1.cash_flow_diagram(ax=ax)
ax.get_legend().remove()
/home/docs/checkouts/readthedocs.org/user_builds/dpd/envs/latest/lib/python3.9/site-packages/dpd/analysis/alternative.py:120: FutureWarning: DataFrame.applymap has been deprecated. Use DataFrame.map instead.
  period_range_pivot["Cost"].applymap(self._plot_na).applymap(lambda x: -x).plot(
/home/docs/checkouts/readthedocs.org/user_builds/dpd/envs/latest/lib/python3.9/site-packages/dpd/analysis/alternative.py:123: FutureWarning: DataFrame.applymap has been deprecated. Use DataFrame.map instead.
  period_range_pivot["Benefit"].applymap(self._plot_na).plot(
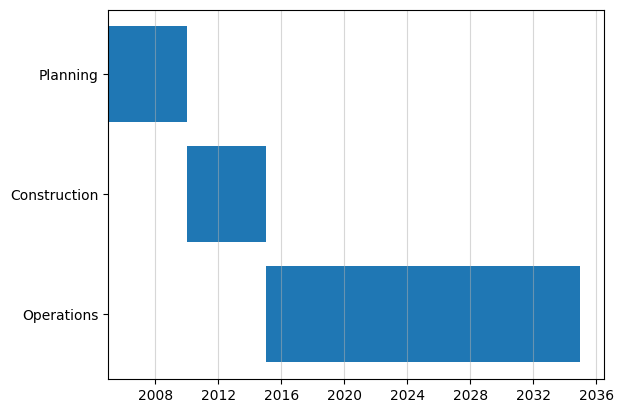
Timeline
[5]:
from dpd.analysis import Timeline

t = Timeline()
for activity in [planning, construction, operations]:
    t.add_activity(activity)

fig, ax = plt.subplots()
t.plot_gantt(ax=ax)
plt.show()
[6]:
fig, ax = plt.subplots()
a1.timeline.plot_gantt(ax=ax)
plt.show()

Decision
[7]:
from datetime import datetime
from random import randint

from astropy import units

from dpd.analysis import Alternative, Currency, Decision
from dpd.analysis.criteria import AttributeCriterion, CostCriterion, Criterion

USD = Currency("USD", 2020, 0.07).discount()
decision = Decision()

no_build_alternative = Alternative("No Build Alternative")
no_build_alternative.some_cost = 0 * USD
alternative_one = Alternative("Alternative 1")
alternative_one.some_cost = 100 * USD
alternative_two = Alternative("Alternative 2")
alternative_two.some_cost = 200 * USD


@property
def travel_time(self):
    return randint(100, 200) * units.second


setattr(Alternative, "travel_time", travel_time)

decision.add_criterion(AttributeCriterion("Travel Time", weight=1 / units.second))
decision.add_criterion(
    Criterion("Distance", lambda x: 200 * units.meter, weight=1 / units.meter)
)
decision.add_criterion(AttributeCriterion("Some Cost", weight=1 / USD))

for alternative in [no_build_alternative, alternative_one, alternative_two]:
    decision.add_alternative(alternative)

decision
[7]:
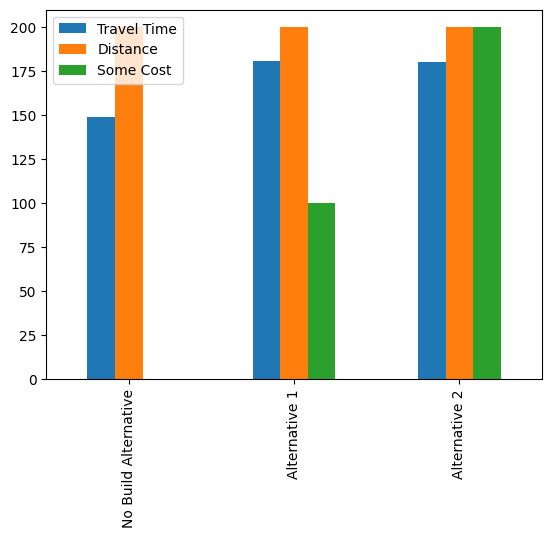
| Travel Time | Distance | Some Cost | |
|---|---|---|---|
| No Build Alternative | 149.0 s | 200.0 m | 0.0 USD (2020) |
| Alternative 1 | 181.0 s | 200.0 m | 100.0 USD (2020) |
| Alternative 2 | 180.0 s | 200.0 m | 200.0 USD (2020) |
[8]:
decision.plot(kind="bar")
[8]:
<Axes: >
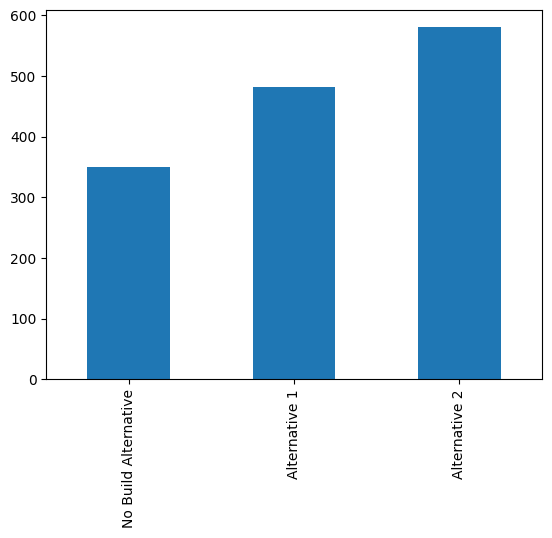
[9]:
decision.multiple_criteria_decision_analysis().plot(kind="bar")
[9]:
<Axes: >
Values
[10]:
from dpd.analysis.values import (
    Value_of_Reduced_Fatalities_and_Injuries,
    Value_of_Travel_Time_Savings,
)
[11]:
Value_of_Reduced_Fatalities_and_Injuries
[11]:
O - No Injury                         3900.0 USD (2020)
C - Possible Injury                  77200.0 USD (2020)
B - Non-incapacitating              151100.0 USD (2020)
A - Incapacitating                  554800.0 USD (2020)
K - Killed                        11600000.0 USD (2020)
U - Injured (Severity Unknown)      210300.0 USD (2020)
Injury Crash                        302600.0 USD (2020)
Fatal Crash                       12837400.0 USD (2020)
Name: Value of Reduced Fatalities and Injuries, dtype: object
[12]:
Value_of_Travel_Time_Savings
[12]:
General Travel Time - Personal                           16.2 USD (2020) / (h person)
General Travel Time - Business                           29.4 USD (2020) / (h person)
General Travel Time - All Purposes                       17.8 USD (2020) / (h person)
Walking Cycling, Waiting, Standing, and Transfer Time    32.4 USD (2020) / (h person)
Commercial Vehicle Operators - Truck Drivers             32.0 USD (2020) / (h person)
Commercial Vehicle Operators - Bus Drivers               33.6 USD (2020) / (h person)
Commercial Vehicle Operators - Transit Rail Operators    50.7 USD (2020) / (h person)
Commercial Vehicle Operators - Locomotive Engineers      52.5 USD (2020) / (h person)
Name: Value of Travel Time Savings, dtype: object
[13]:
from astropy.units import day, minute, year
from dpd.analysis.units import person, usd2020
[14]:
(
    5
    * minute
    * 40000
    * person
    / day
    * Value_of_Travel_Time_Savings[
        "Walking Cycling, Waiting, Standing, and Transfer Time"
    ]
).decompose().to(usd2020 / year)
[14]:
$39447000 \; \mathrm{\frac{USD (2020)}{yr}}$
[ ]:
[ ]: